at Harrisburg UniversityProfessional Development
Future-Proof Your Skills. Advance Your Career.
Empower your potential with industry-leading programs built for today’s professionals. Whether you’re leveling up, pivoting careers, or enhancing your team’s capabilities, Harrisburg University delivers flexible, hands-on training to get you there.
HU Professional Development
At Harrisburg University, professional development isn’t just about keeping up—it’s about staying ahead. Whether you’re aiming to boost your career, earn a certification, or empower your team with new skills, our industry-driven programs are built to meet the demands of today’s fast-paced world. With flexible formats, expert instructors, and a focus on real-world application, HU helps professionals and organizations thrive in the ever-evolving landscape of science, technology, and business.
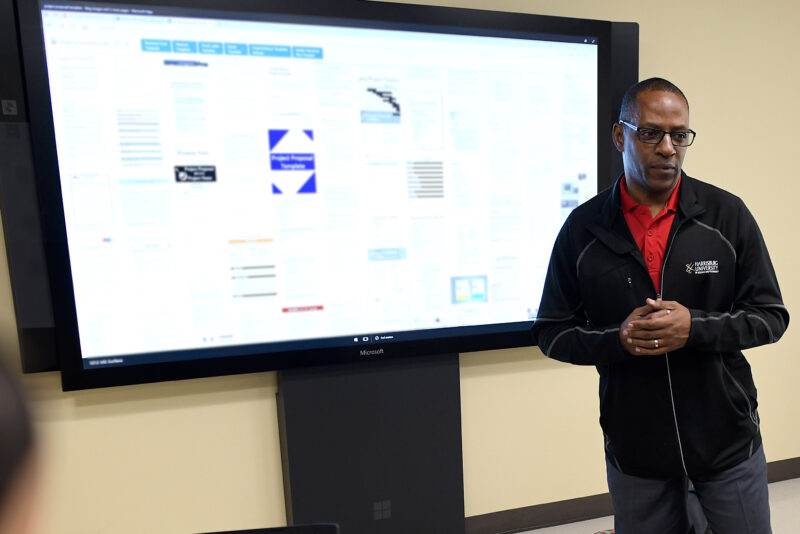
Expert-Led Instruction
Learn from industry pros and university faculty with real-world experience.
Career-Driven Curriculum
Programs designed to align with in-demand skills across tech, science, and business.

Flexible Options
Online, in-person, and hybrid formats that fit your schedule.

Stackable Credentials
Earn certificates that can boost your resume—or stack toward advanced degrees.

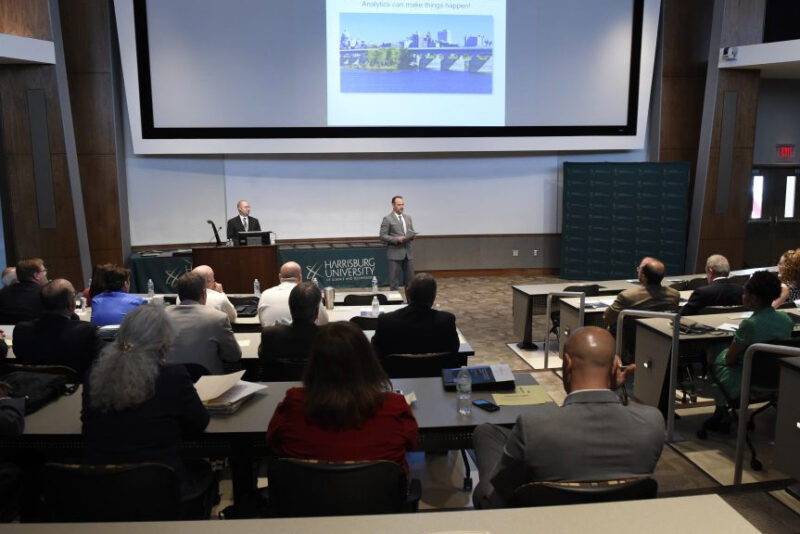
Customized Corporate Training
Upskill your workforce with training designed for your organization.


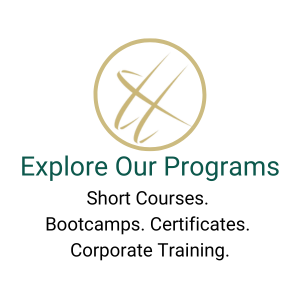
Upcoming Programs
Harrisburg University provides a host of professional development opportunities throughout the year.